


I came across this product from an ad and decided to give it a try. These molds are significantly easier to use than any competitor’s products and they yield perfect ice every time. I also do appreciate that they send extra liner cups too. Great product!
Pedí 3 y ahora he vuelto a pedir otros dlos, creo que eso es lo mejor que puedo decir de estos artículos.
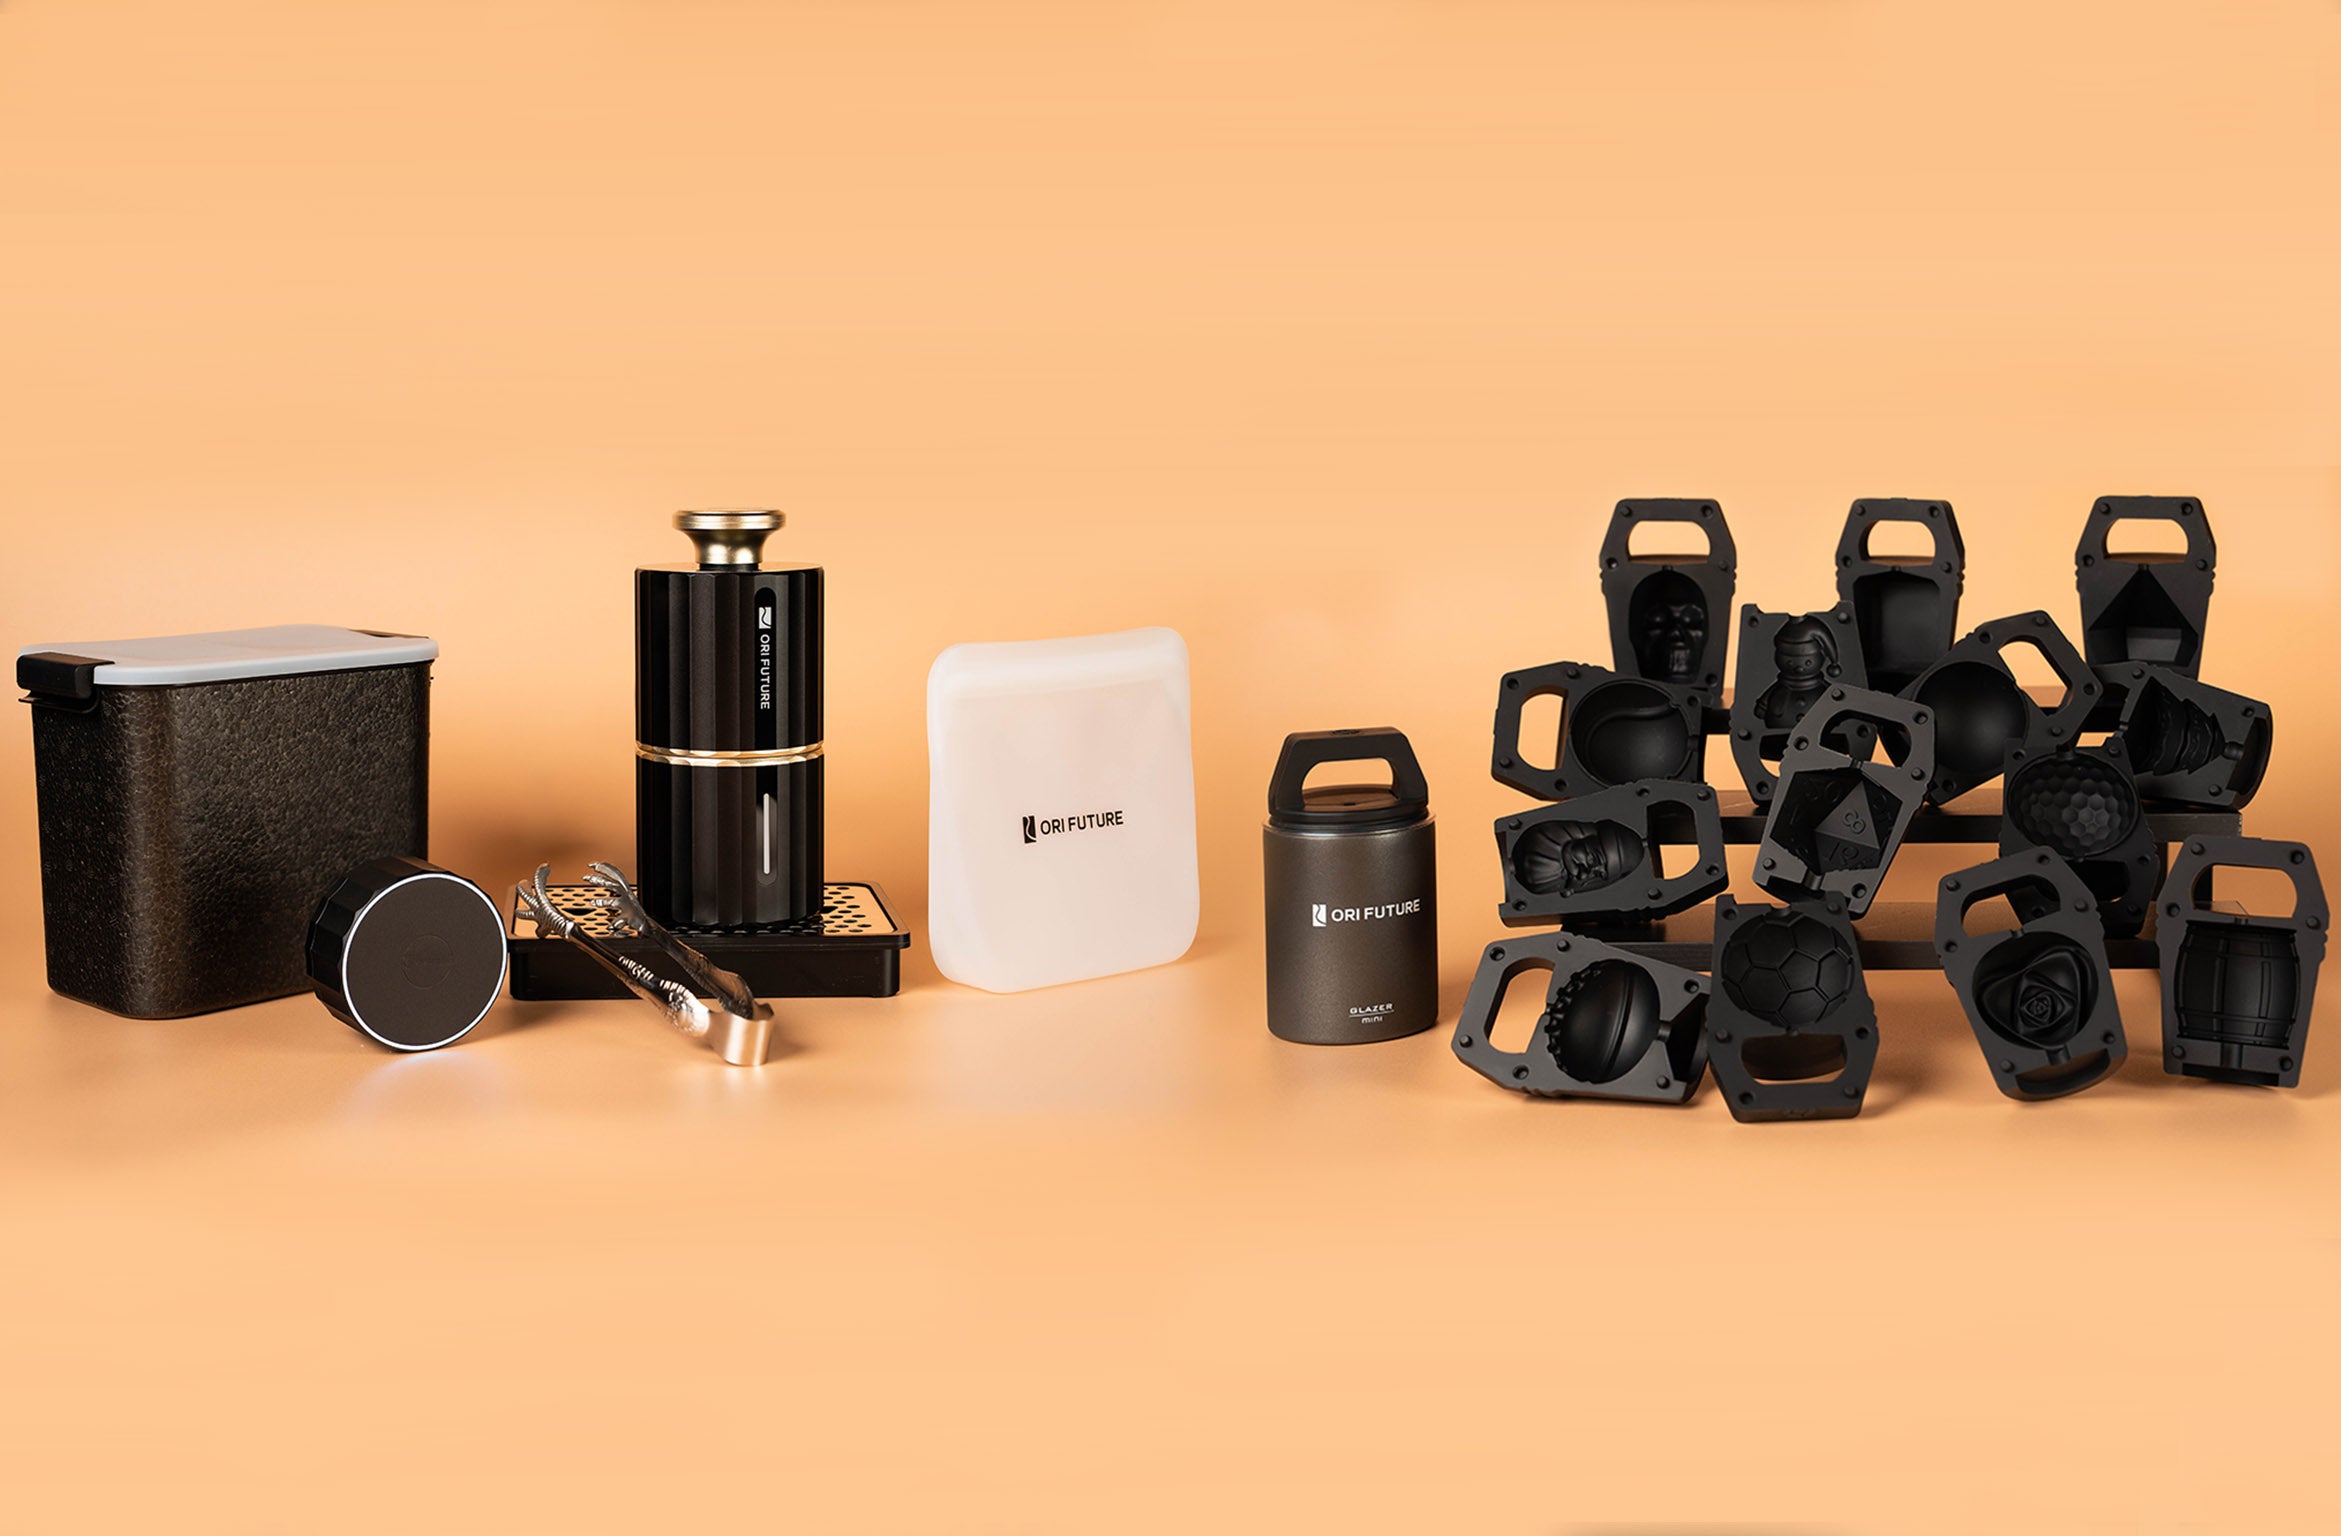
Son cómodos, al estar de pie ocupan poco espacio y se desmoldan co facilidad
Pedí 3 y ahora he vuelto a pedir otros dlos, creo que eso es lo mejor que puedo decir de estos artículos.
Son cómodos, al estar de pie ocupan poco espacio y se desmoldan co facilidad
Seriously. How often is it that a purchased product does exactly what it says it will? This one actually does! Amazing. A bit delayed delivery but all is forgiven!
I did not want something I would only use on holidays and Plastic Liner for GLAZER mini x 5 has been fine for regular use. Quick to fill, easy release, and the ice still looks impressive.
If you like a serious cube in the glass, Plastic Liner for GLAZER mini x 5 delivers on presence. It looks substantial, melts in a way I like, and the mold is manageable.
Iced tea looks surprisingly nicer with Plastic Liner for GLAZER mini x 5. It is a small visual upgrade, easy to repeat, and I have kept using it all summer.
Plastic Liner for GLAZER mini x 5 feels well made when you handle it. Not too flimsy, not awkward to fill, and the finished cubes look uniform.
Pairing Plastic Liner for GLAZER mini x 5 with a bottle was a hit. People get the point immediately, it looks premium, and it is useful beyond the first week.
For non-alcoholic drinks, Plastic Liner for GLAZER mini x 5 still makes everything feel more special. The ice looks great in colorful mocktails and it is easy to keep on hand.
I was curious whether Plastic Liner for GLAZER mini x 5 would really make a difference and it actually does. It has been easy to use, the ice comes out looking sharp, and it feels like a nicer option than the usual freezer tray setup.
Before hosting, I can prep Plastic Liner for GLAZER mini x 5 ahead and not stress day-of. The ice holds up fine for what I need, looks great in pitchers, and guests comment on it.
Picked up Plastic Liner for GLAZER mini x 5 because I wanted cleaner-looking ice at home and it absolutely delivered. The mold is easy to fill, the ice comes out looking great, and it instantly makes iced coffee or a night drink feel a little more put together.
If you are the type who notices details in a drink, GLAZER Press: Reshape Ice, Reshape Moments. rewards that. Subtle upgrade, not loud branding.
It is a quiet improvement to my drink routine. GLAZER Press: Reshape Ice, Reshape Moments. does not demand attention, it just works.
My freezer runs a bit warm sometimes and GLAZER Press: Reshape Ice, Reshape Moments. still froze reliably enough for me.
Mocktail nights at home feel a notch nicer with GLAZER Press: Reshape Ice, Reshape Moments.. The ice reads clean in colorful drinks.
If you will use it weekly, GLAZER Press: Reshape Ice, Reshape Moments. feels like fair value. The per-use cost is low and the enjoyment is consistent.
I almost overthought which mold to buy; GLAZER Press: Reshape Ice, Reshape Moments. ended up being a simple choice that worked.
Even with flavored syrups, GLAZER Press: Reshape Ice, Reshape Moments. ice still looks neat in the glass instead of turning the drink into a murky mess right away.
GLAZER Press: Reshape Ice, Reshape Moments. is one of those products that just works. It is straightforward to prep, the result looks clean, and it has been a solid little improvement for everyday drinks. Shipping was smooth and everything arrived in good condition.
I wanted something practical for everyday drinks and GLAZER Press: Reshape Ice, Reshape Moments. fits that role. Simple to use, decent results, and I have kept reaching for it.
GLAZER Press: Reshape Ice, Reshape Moments. became a normal everyday companion in my kitchen, not a special-occasion-only tool.
I worried GLAZER Press: Reshape Ice, Reshape Moments. might be gimmicky but in practice it is just useful. Looks better than average ice and stays easy to use.
I used to fight stuck cubes daily. GLAZER Press: Reshape Ice, Reshape Moments. reduced that annoyance a lot.
